Targeted research and product development require understanding the available data.
The immense volume of data must be processed to become accessible for immediate decisions.
Despite high investments of time and money, such analyses are often incomplete and inaccurate.
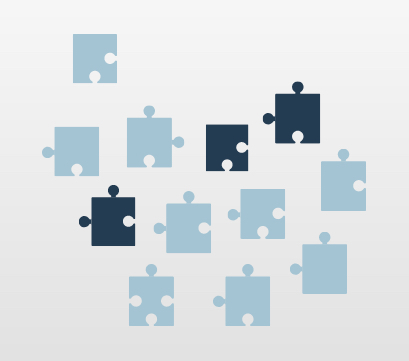
Data Quantity
Unstructured information
leads to inclusion of irrelevant data
Quality of Analyses
Too many or irrelevant
connections;
not all perspectives
considered
Missing details
No overview
Poor decisions
Data Quantity
Unstructured information
leads to inclusion of irrelevant data
Quality of Analyses
Too many or irrelevant
connections;
not all perspectives
considered
Missing details
No overview
Poor decisions
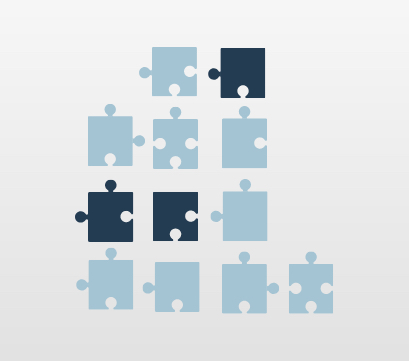
L&C Approach
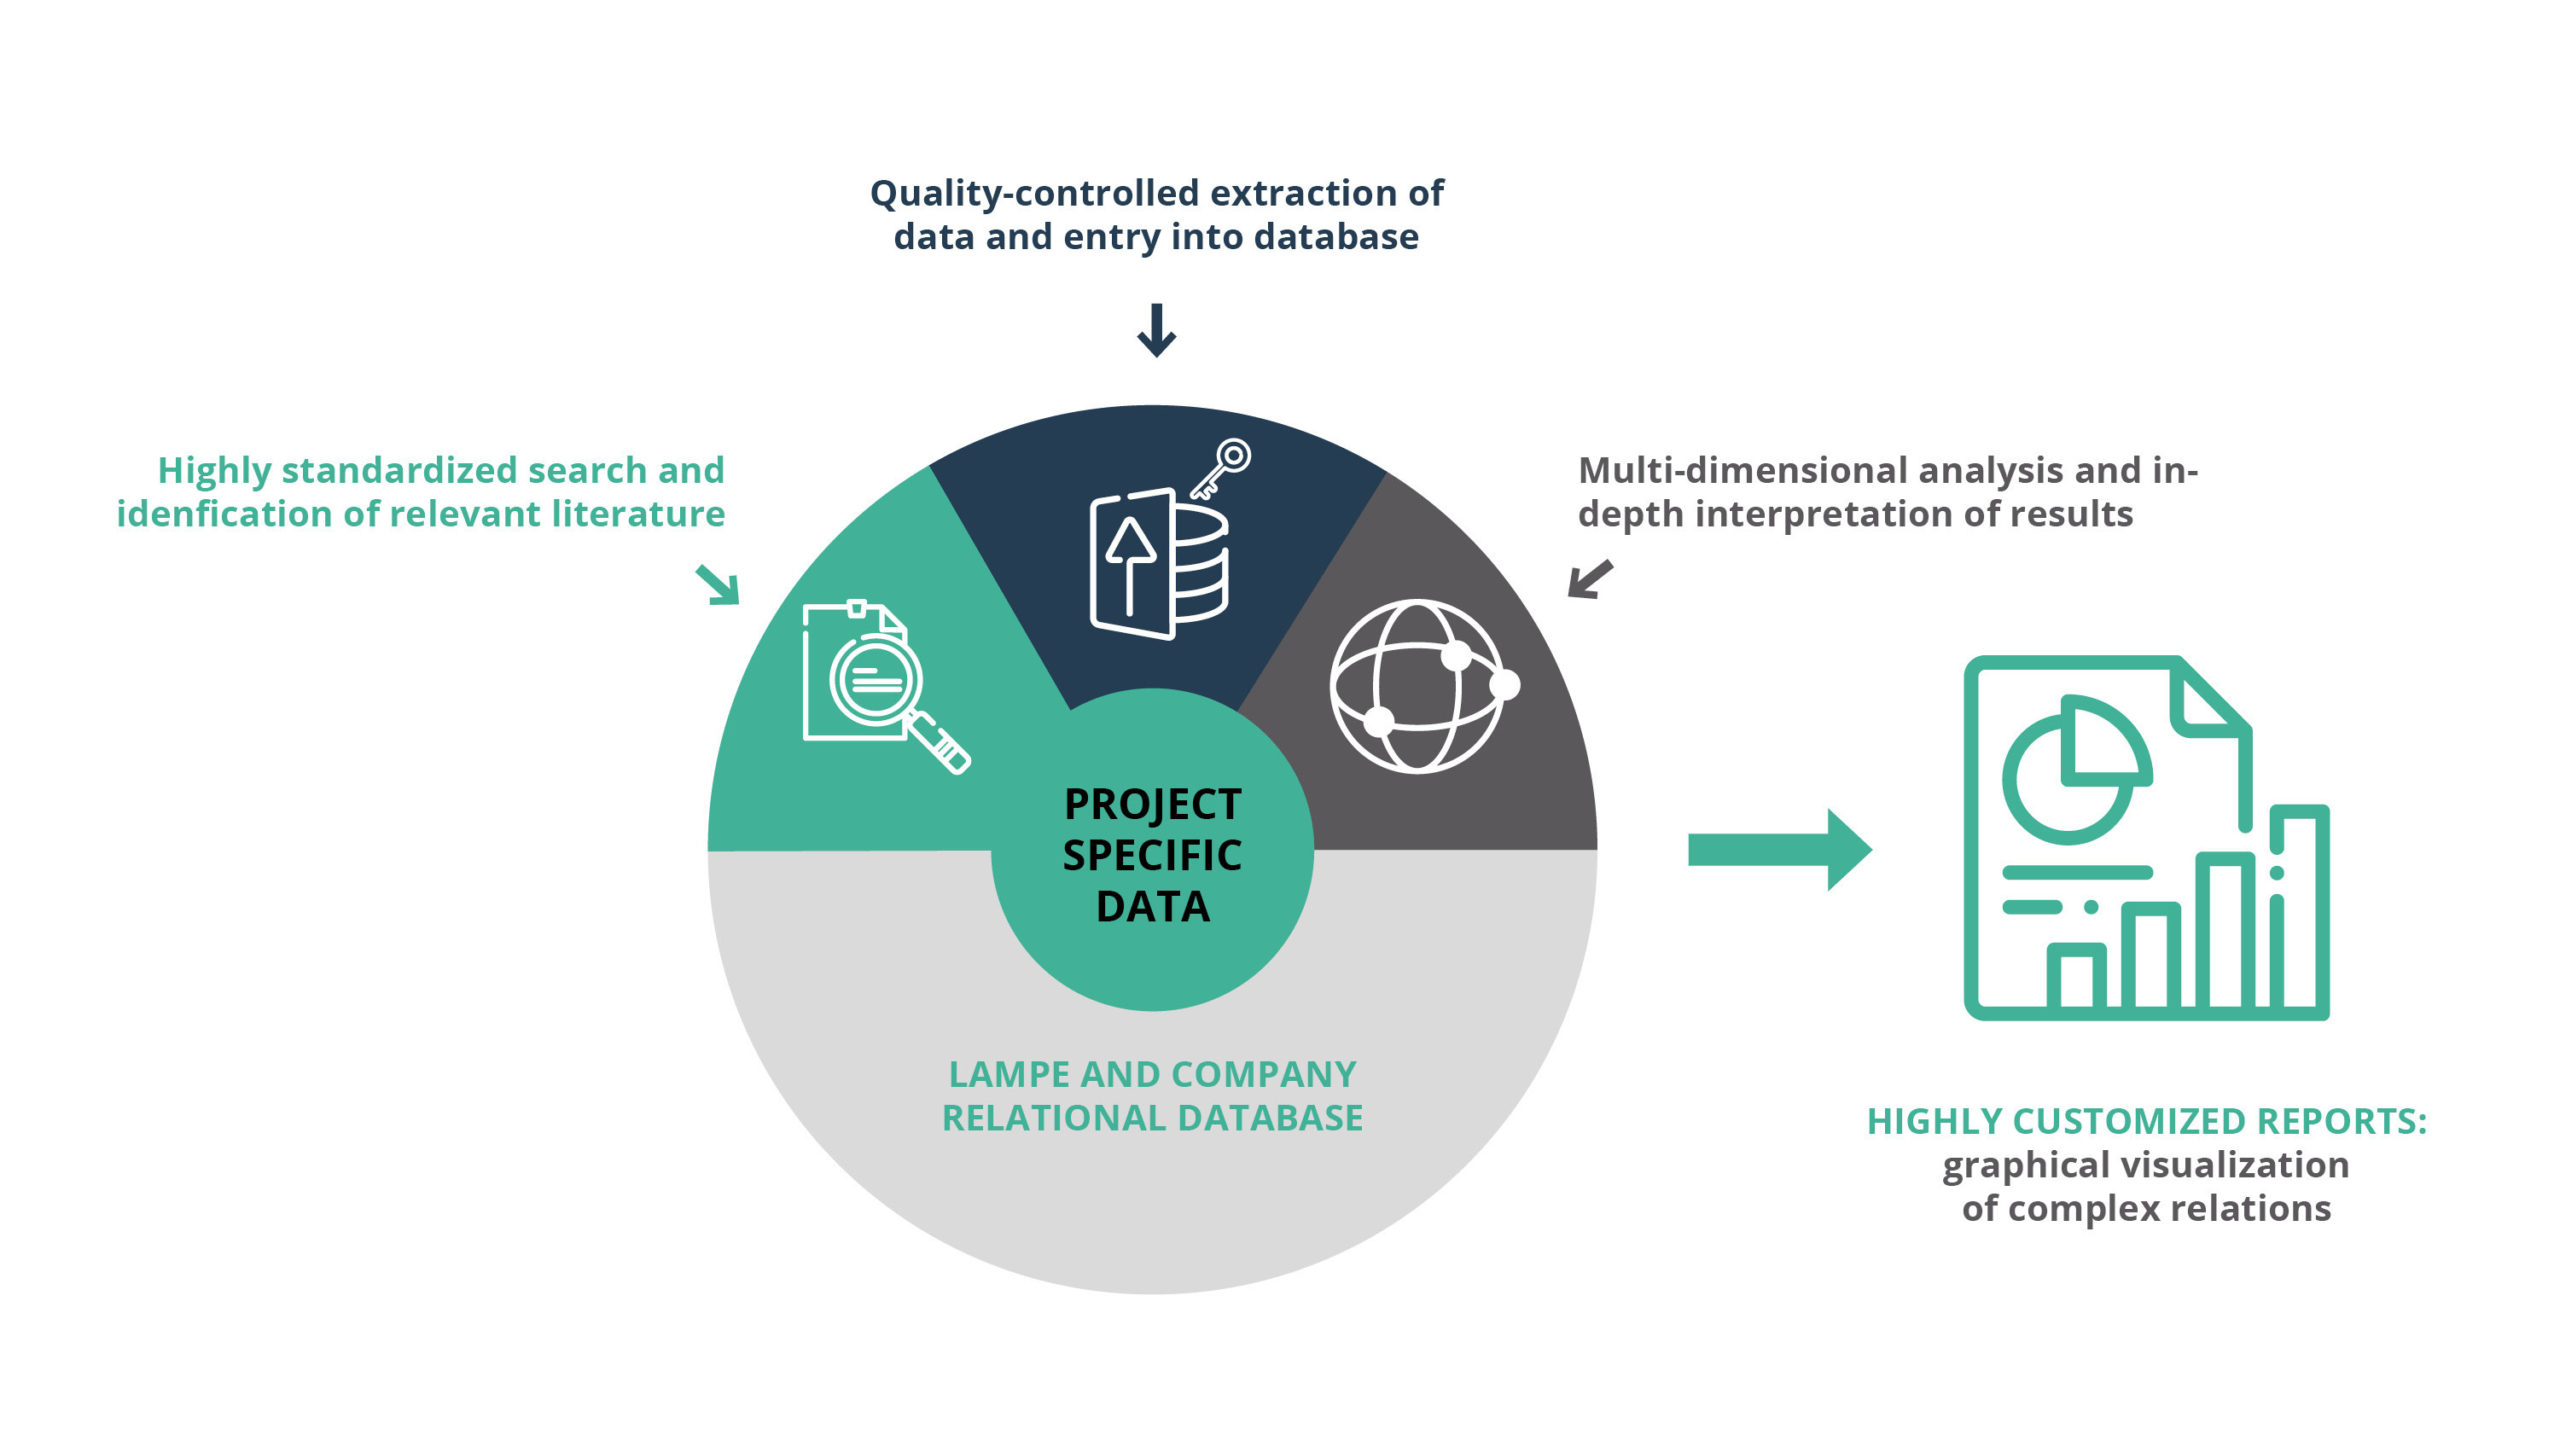
Lampe & Company identifies all relevant data points from the entire flood of information and processes them into an easily understandable format.
This way, Lampe & Company provides the best analysis quality available on the market, enabling better data-based decisions.
Data Quantity
Standardization and categorization of all information – only relevant data points considered
Quality of Analyses
Compilation of all relationships – only those with enough scientific evidence considered
Relevant details
only Transparent overview
Clear decision basis
Data Quantity
Standardization and categorization of all information – only relevant data points considered
Quality of Analyses
Compilation of all relationships – only those with enough scientific evidence considered
Relevant details
only Transparent overview
Clear decision basis
The L-Matrix
The L-Matrix Method addresses key challenges met by pharmaceutical, medical technology, biotech and life science companies in the Research and Development (R&D) process, by enabling evidence-based decision making to:
Minimize the risk of failing compounds and devices
Obtain the broadest possible product label
Focus on product differentiation to identify the most adequate niche
Assess the product pipeline and product portfolio
Optimize study designs
The L-Matrix Method ultimately increases the success of your R&D process: by overriding intrinsic weaknesses and identifying hidden strengths, thus granting your company competitive intelligence founded on differential assessment of competitor or own compounds/products.
Your Benefits
Selected by R&D professionals and digitally processed with human intellect and understanding.
Best possible data quality (SOP-driven & quality-controlled data selection and evaluation)
Complete data set, only relevant data (highest possible sensitivity and specificity of search process)
Traceability of each data point
Intuitive understanding of all aspects
360° view (all perspectives)
Ready to use for decisions (no additional efforts for further data search/compilation needed)
This website uses cookies to improve your experience. We'll assume you're ok with this, but you can opt-out if you wish. Cookie settingsACCEPT
Privacy & Cookies Policy
Privacy Overview
This website uses cookies to improve your experience while you navigate through the website. Out of these cookies, the cookies that are categorized as necessary are stored on your browser as they are essential for the working of basic functionalities of the website. We also use third-party cookies that help us analyze and understand how you use this website. These cookies will be stored in your browser only with your consent. You also have the option to opt-out of these cookies. But opting out of some of these cookies may have an effect on your browsing experience.
Necessary cookies are absolutely essential for the website to function properly. This category only includes cookies that ensures basic functionalities and security features of the website. These cookies do not store any personal information.
Any cookies that may not be particularly necessary for the website to function and is used specifically to collect user personal data via analytics, ads, other embedded contents are termed as non-necessary cookies. It is mandatory to procure user consent prior to running these cookies on your website.